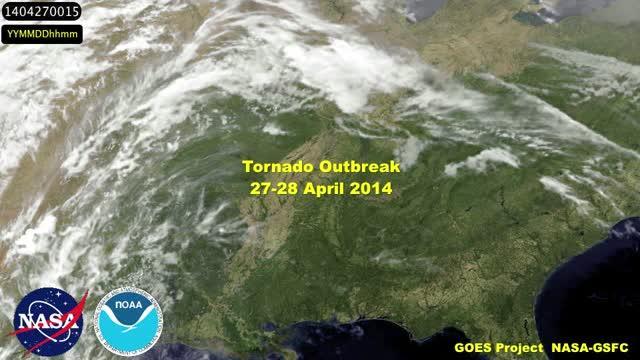
NOAA's GOES-East satellite sits in a fixed orbit in space capturing visible and infrared imagery of weather over the eastern U.S. and Atlantic Ocean. The GOES-East satellite is operated by the National Oceanic and Atmospheric Administration. NASA/NOAA's GOES Project at the NASA Goddard Space Flight Center in Greenbelt, Md. created the animation of GOES-East satellite data that covered the period during the tornado outbreak.
The GOES-East animation of visible and infrared imagery runs 31 seconds. The animation begins on April 27 at 00:15 UTC (April 26 at 8:15 p.m. EDT) and runs through April 28 at 14:15 UTC/10:15 a.m. EDT. By 14:45 UTC/10:45 a.m. EDT on April 27 the animation shows the squall line of thunderstorms developing.
To create the video and imagery, NASA/NOAA's GOES Project takes the cloud data from NOAA's GOES-East satellite and overlays it on a true-color image of land and ocean created by data from the Moderate Resolution Imaging Spectroradiometer (MODIS) instrument that flies aboard NASA's Aqua and Terra satellites. Together, those data created the entire picture of the storm system and show its movement.

This animation of NOAA's GOES-East satellite data shows the development and movement of the weather system that spawned tornadoes affecting seven central and southern US states on Apr. 27-28, 2014.
(Photo Credit: NASA/NOAA GOES Project)
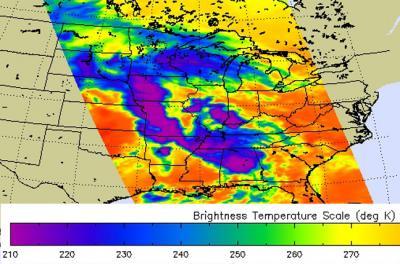
A NASA satellite also captured an image of the storm, collecting infrared data on it as it passed overhead on April 27. At NASA's Jet Propulsion Laboratory (JPL) in Pasadena, Calif. a false-colored image was created of the storm system using data gathered by the Atmospheric Infrared Sounder (AIRS) instrument that flies aboard NASA's Aqua satellite on April 27 at 18:59 UTC (1:59 p.m. CDT). The AIRS image showed very cold cloud top temperatures indicating that the thunderstorms had strong uplift that pushed cloud tops to the top of the troposphere. Some of those thunderstorms had cloud tops as cold as 200 kelvin (-99.6 F/-73.1C). Temperatures drop to just under 220 degrees kelvin at the top of the troposphere (and where the tropopause begins).
"AIRS data shows spatial extent of strong convection [rapidly rising air that condenses and forms clouds] in the slow-moving severe storm system that spawned tornadoes in Arkansas, Oklahoma and Iowa," said Ed Olsen, creator of the AIRS image at NASA JPL. The AIRS image showed the thunderstorms with coldest cloud top temperatures stretched from eastern Nebraska, through western Iowa, western Missouri, northern Arkansas and southeast into northern Mississippi and Alabama.
According to the Examiner.com, the National Weather Service's Storm Prediction Center counted 31 tornadoes on Sunday, April 27, however, that number is being refined as reports are analyzed.
CBS News reported that one tornado touched down 10 miles west of Little Rock, Arkansas around 7 p.m. CDT (at around 22:02 UTC in the GOES animation) and stayed on the ground for about 80 miles passing near several suburbs north of the city. That tornado was reported to be one-half mile wide.
The same system that spawned these tornadoes is expected to bring the possibility for severe weather further east on April 28 from Cincinnati, Ohio to New Orleans, La. For more information about current risks for severe weather, visit NOAA's Storm Prediction Center at: http://www.spc.noaa.gov.
GOES satellites provide the kind of continuous monitoring necessary for intensive data analysis. Geostationary describes an orbit in which a satellite is always in the same position with respect to the rotating Earth. This allows GOES to hover continuously over one position on Earth's surface, appearing stationary. As a result, GOES provide a constant vigil for the atmospheric "triggers" for severe weather conditions such as tornadoes, flash floods, hail storms and hurricanes.

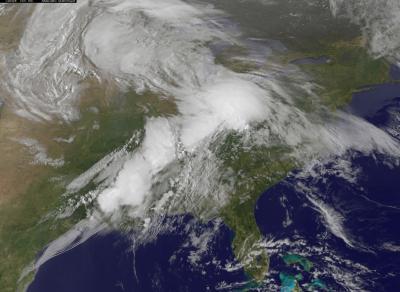
This NOAA GOES-East satellite image from Monday, Apr. 28, 2014 at 13:01 UTC/9:01 a.m. EDT shows the same storm system that generated the severe weather outbreak yesterday, has moved to the east.
(Photo Credit: NASA/NOAA GOES Project)

This false-colored infrared image from the AIRS instrument aboard NASA's Aqua satellite shows the cold cloud top temperatures associated with the severe thunderstorms that brought severe weather to seven states on Apr. 27.
(Photo Credit: NASA/JPL, Ed Olsen)
Source: NASA/Goddard Space Flight Center