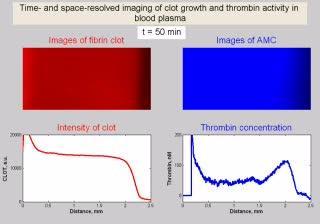
This movie shows the formation and propagation of thrombin activity and a fibrin clot in plasma stimulated with immobilized TF (90 pmol/m2). Imaging of thrombin activity in blood plasma from a healthy individual reveals a propagating wave. Upper row: The fibrin clot illuminated with red light grows from the activation surface (left). Thrombin formed during this process cleaves the substrate, and the fluorescence of released AMC is recorded (right). Lower row: Light scattering intensity (left) and distribution of thrombin concentration calculated from the AMC fluorescence intensity distribution (right).
(Photo Credit: Dashkevich et al., Biophysical Journal)

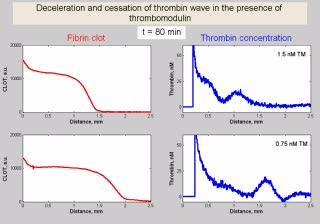
This movie demonstrates the deceleration and cessation of the thrombin wave in the presence of thrombomodulin (TF density is 4 pmol/m2). Upper row: When the thrombomodulin concentration is high enough (1.5 nM), cessation of the thrombin wave can be observed. Light scattering intensity profile (left) and thrombin concentration profile (right) are shown. Clot growth rate decreases up to the full stop, and spreading of the thrombin wave stops. Lower row: In the case of a lower thrombomodulin concentration, the thrombin peak decelerates gradually, with a decrease in height (right). Light scattering profiles are shown on the left.
(Photo Credit: Dashkevich et al., Biophysical Journal)
Source: Cell Press