Hurricane Amanda has weakened to a tropical storm, but not before NASA's TRMM satellite took a look under its clouds at the rate of heavy rainfall it was generating. After weakening to a tropical storm, NASA's Aqua satellite identified that those strong thunderstorms were limited to the area around the center of its circulation.
The Tropical Rainfall Measuring Mission satellite known as TRMM passed over Amanda on Saturday May 24, 2014 at 2150 UTC (5:50 p.m. EDT). TRMM is a joint mission between NASA and the Japan Aerospace Exploration Agency known as JAXA.
At NASA's Goddard Space Flight Center in Greenbelt, Maryland, rainfall data from TRMM's Microwave Imager (TMI) and Precipitation Radar (PR) instruments were overlaid on a GOES-15 visible/infrared image received at 2200 UTC (6 p.m. EDT). That was about six hours after Amanda was upgraded to a hurricane. At that time, Amanda had winds of about 70 knots (80.5 mph). TRMM's Precipitation Radar (PR) instrument had an excellent view of the rain falling at a rate of over 147 mm (about 5.8 inches) per hour in the northwestern side of the Amanda's eye wall. Intense storms in that area were reaching heights of over 16.3 km (about 10.1 miles).

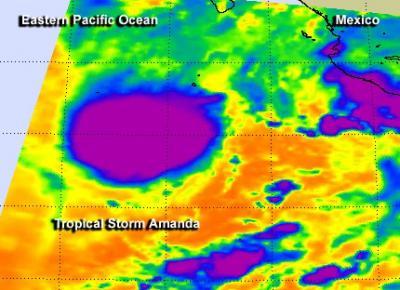
This false-colored infrared image taken on May 28 from NASA's Aqua satellite shows that the concentration of the strongest thunderstorms (purple) within Hurricane Amanda was around the center of circulation.
(Photo Credit: Image : NASA JPL, Ed Olsen)
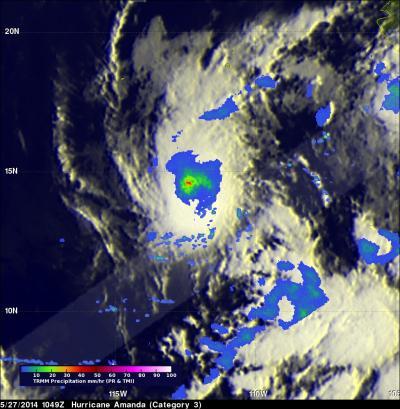
The TRMM satellite had two other good views of Hurricane Amanda: on Sunday, May 25 at 2054 UTC (4:54 p.m. EDT) and on Tuesday, May 27 at 1049 UTC (6:49 a.m. EDT).
On May 25, Hurricane Amanda had winds speeds estimated at 130 knots (about 150 mph). Two days later on May 27 Amanda was still a very strong hurricane with winds of about 110 knots (about 127 mph).
A false-colored infrared image showing cloud top temperatures in Amanda was taken by the Atmospheric Infrared Sounder (AIRS) instrument that flies aboard NASA's Aqua satellite. The image was created at NASA's Jet Propulsion Laboratory in Pasadena, California using data from May 28 at 08:59 UTC (4:59 a.m. EDT). The infrared image showed the concentration of the strongest thunderstorms (with the coldest cloud top temperatures within Hurricane Amanda were around the center of circulation.
The National Hurricane Center (NHC) discussion on May 28 said "although Amanda is producing a considerable amount of deep convection, with cloud tops as cold as -85 C (-121 F), the cloud pattern lacks organization."
On May 28 at 8 a.m. PDT (11 a.m. EDT) the center of Tropical Storm Amanda was located near latitude 15.0 north and longitude 112.0 west, about 560 miles (905 km) south-southwest of the southern tip of Baja California, Mexico. Amanda has weakened to a tropical storm with maximum sustained winds near 65 mph (100 kph). Amanda was moving toward the northeast near 3 mph (6 kph) and a slightly faster Northeastward motion is expected during the next day or two, according to the National Hurricane Center.
NHC Forecaster Cangialosi noted that even though wind shear is forecast to lessen on Thursday, Amanda is expected to continue to lose strength due to dry air entrainment (dry air moving in will sap the moisture needed to create thunderstorms that make up a tropical cyclone) and lower sea surface temperatures along the forecast track.
NHC forecasters noted that Amanda could become a tropical depression by early Friday, May 30.

The TRMM satellite captured this view of Hurricane Amanda on May 25 at 2054 UTC (4:54 p.m. EDT) when it was a Category 4 hurricane. Red areas indicate heavy rainfall.
(Photo Credit: Image : SSAI/NASA Goddard, Hal Pierce)

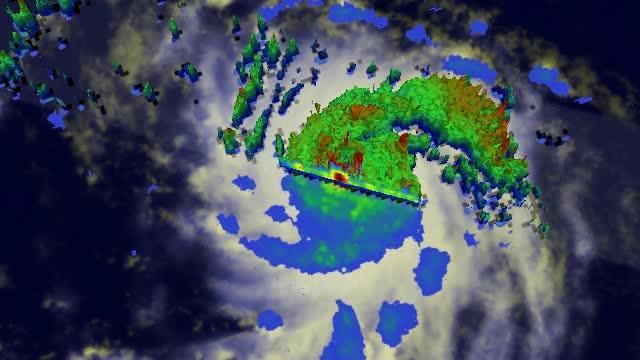
The TRMM satellite flew over Hurricane Amanda on Tuesday, May 27 at 1049 UTC (6:49 a.m. EDT) and captured rainfall rates and cloud height data that was used to create this 3-D simulated flyby. Credit:
(Photo Credit: Image : SSAI/NASA Goddard, Hal Pierce)
Source: NASA/Goddard Space Flight Center