This event was particularly exciting for the IRIS team, as this was the first X-class flare ever observed by IRIS. IRIS launched in June 2013 to zoom in on layers of the sun, called the chromosphere and transition region, through which all the energy and heat of a flare must travel as it forms. This region, overall is called the interface region, has typically been very hard to untangle – but on March 29, IRIS provided scientists with the first detailed view of what happens in this region during a flare.
Coordinated observations are crucial to understanding such eruptions on the sun and their effects on space weather near Earth. Where terrestrial weather watching involves thousands of sensors and innumerable thermometers, solar observations still rely on a mere handful of telescopes. The instruments on the observatories are planned so that each shows a different aspect of the flare at a different heights off the sun's surface and at different temperatures. Together the observatories can paint a three-dimensional picture of what happens during any given event on the sun.
In this case, the Dunn Solar Telescope helped coordinate the space-based observatories. Lucia Kleint is the principal investigator of a NASA-funded grant at the Bay Area Environmental Research Institute grant to coordinate ground-based and space-based flare observations. While she and her team were hunting for flares during ten observing days scheduled at Sacramento Peak, they worked with the Hinode and IRIS teams a day in advance to coordinate viewing of the same active region at the same time. Active regions are often the source of solar eruptions, and this one was showing intense magnetic fields that moved in opposite directions in close proximity – a possible harbinger of a flare. However, researchers do not yet know exactly what conditions will lead to a flare so this was a best guess, not a guarantee.
But the guess paid off. In the space of just a few minutes, the most comprehensive flare data set of all time had been collected. Now scientists are hard at work teasing out a more detailed picture of how a flare starts and peaks – an effort that will help unravel the origins of these little-understood explosions on the sun.
Watch the movie to see the wealth of colorful NASA observations of an X-class flare on March 29 -- the most comprehensively observed flare, ever.BROADCAST QUALITY: http://svs.gsfc.nasa.gov/vis/a010000/a011500/a011522/.
(Photo Credit: : NASA/NSO/Goddard Space Flight Center)
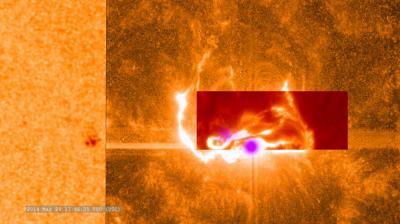
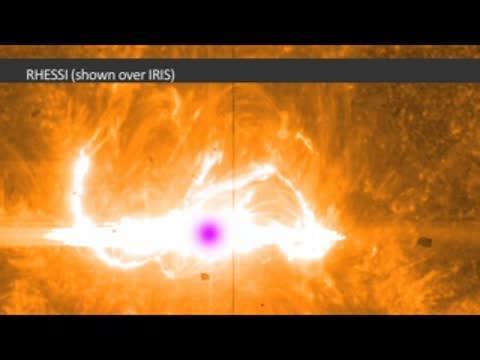
This combined image shows the March 29, 2014, X-class flare as seen through the eyes of different observatories. SDO is on the bottom/left, which helps show the position of the flare on the sun. The darker orange square is IRIS data. The red rectangular inset is from Sacramento Peak. The violet spots show the flare's footpoints from RHESSI.
(Photo Credit: NASA)
Source: NASA/Goddard Space Flight Center