Tropical Cyclone Ita made landfall in northeastern Queensland, Australia on April 11 as a powerful Category 4 hurricane on the Saffir-Simpson scale, moved south and re-emerged in the Coral Sea on April 14 where NASA's TRMM and NASA-NOAA's Suomi NPP Satellites captured imagery of the weakened storm.
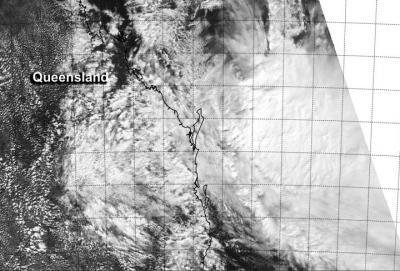
The VIIRS instrument aboard NASA-NOAA's Suomi NPP satellite captured a visible look at Ita's elongating structure on April 14 at 4:12 UTC/12:12. The Visible Infrared Imaging Radiometer Suite (VIIRS) instrument collects visible and infrared imagery and global observations of land, atmosphere, cryosphere and oceans. Strong northwesterly vertical wind shear was evident because the bulk of the storm's clouds were pushed southeast of the center. The VIIRS image also revealed that Ita no longer maintained a rounded shape.
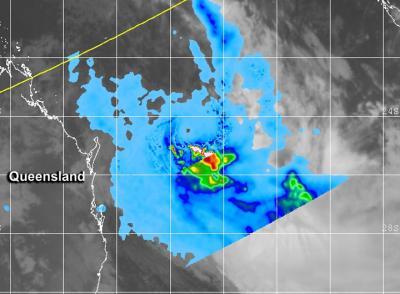
NASA and the Japan Aerospace Exploration Agency's Tropical Rainfall Measuring Mission (TRMM) satellite's Precipitation Radar instrument gathered rainfall data from Ita when it flew overhead on April 14. That rainfall data was combined with infrared data of Ita's clouds from Japan's MTSAT-2 satellite.
The image taken on April 14 at 1050 UTC/6:50 a.m. EDT showed rain fall rates of up to 1.4 inches/35.5 mm per hour falling southeast of Ita's elongated center.

NASA's TRMM satellite rainfall data was combined with infrared data from Japan's MTSAT-2 to create this image of Tropical Cyclone Ita over the Coral Sea on April 14 at 1050 UTC. Heavy rainfall appears in red at 1.4 inches per hour.
(Photo Credit: NRL/NASA/JAXA)
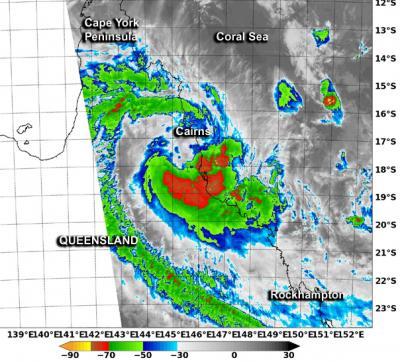
After Tropical cyclone Ita made landfall on April 11, it continued tracking over land on the eastern Cape York Peninsula of Queensland, Australia where it weakened to a tropical storm. The Moderate Resolution Imaging Spectroradiometer (MODIS) instrument aboard NASA's Terra satellite captured an infrared image of Ita on April 12 at 1225 UTC/8:25 a.m. EDT. The MODIS image showed very high, powerful thunderstorms with very cold cloud top temperatures were south of the center of circulation. The thick band of thunderstorms had cloud top temperatures that were as cold as -80F/-62.2C. Those thunderstorms had the potential for heavy rainfall.
According to the Brisbane Times, Ita did not cause any loss of life, but did damage agriculture. Ita reportedly destroyed banana crops and flattened cane fields. Flooding from heavy rainfall also cut off the Bruce Highway, Queensland's main highway.
On April 12 at 1200 UTC (8 a.m. EDT U.S. and April 13 at 2:00 a.m. local time) the Australian Bureau of Meteorology (ABM) noted that a Cyclone Warning remained in effect for coastal areas from Cape Tribulation to St. Lawrence. A Cyclone Watch remained in effect for coastal areas from St. Lawrence to Yeppoon. Heavy rainfall, flash flooding, gale-force winds and rough surf can be expected in the warning area. ABM warned that abnormally high tides were expected between Innisfail and Townsville.
On April 12, the Joint Typhoon Warning Center (JTWC) reported animated multispectral satellite imagery revealed that Ita's structure remained well-defined, even over land. Radar imagery from Cairns showed strong bands of thunderstorms along the eastern quadrant of the storm.

This visible image of an elongated Tropical Cyclone Ita was taken from the VIIRS instrument aboard NASA-NOAA's Suomi NPP satellite on April 14 at 4:12 UTC/12:12.
(Photo Credit: NRL/NASA/NOAA)
On April 12 at 0900 UTC/5 a.m. EDT, Tropical Storm Ita had maximum sustained winds near 50 knots/57.5 mph/92.6 kph. It was centered near 17.0 south latitude and 145.5 east longitude, about 31 nautical miles/35.7 miles/57.4 km west-northwest of Cairns, Queensland. Tropical cyclone Ita has tracked south-southeastward at 6 knots/6.9 miles/11.1 kph.
By April 13 at 12:06 UTC/7 a.m. local time Monday/8 p.m. EDT/U.S., Ita's maximum sustained winds dropped to 45 knots/51.7 mph/83.3 kph. Tropical Cyclone Ita was located off the central Queensland coast near latitude 22.0 south longitude 152.2 east, which is about 121.2 miles/195 km northeast of Yeppoon and 142.9 miles/230 km north northeast of Gladstone.
Satellite imagery showed that the bulk of the convection and thunderstorms associated with Ita were being blown to the south of the center because of strong northwesterly wind shear.
The JTWC's final warning on Ita was issued on April 14 at 0900 UTC/5 a.m. EDT when Ita was back over the Coral Sea. At that time, Ita's maximum sustained winds were down to 40 knots/46.0 mph/74.0 kph. It was centered near 23.7 north latitude and 155.1 east longitude, about 299.2 miles/481.5 km north-northeast of Brisbane, Queensland, Australia. Tropical Storm Ita was moving to the east-southeast at 23 knots/26.4 mph/42.6 kph. All warnings in Queensland were canceled.
JTWC forecasters using animated multispectral satellite imagery noted that Ita was quickly becoming extra-tropical. Ita was embedded in the mid-latitude westerly winds and as a result of that its circulation was starting to stretch out. Strong vertical wind shear was also pushing the strongest thunderstorms to the southeast of the center, and Ita had began taking on frontal characteristics.
JTWC forecasters expect that the vertical wind shear from the westerly winds will speed up the transition into an extra-tropical storm, and by April 15, Ita is expected to be fully extra-tropical.

This image from NASA's Terra satellite on April 12 showed very high, powerful thunderstorms (red) with very cold cloud top temperatures (as cold as -80F/-62.2C) south of the center of circulation.
(Photo Credit: USNRL/NASA)
Source: NASA/Goddard Space Flight Center