Aqua's AIRS instrument captured another infrared image System 93L as it was strengthening into tropical depression 8, and before it became Tropical Storm Gordon. The image was taken on Aug. 15 at 12:53 p.m. EDT, and showed strong bands of thunderstorms to the north and west of the center of circulation where cloud tops were so high into the atmosphere that they were as cold as -63 Fahrenheit (-52 Celsius). When thunderstorms that make up tropical cyclones reach such heights, they likely contain heavy rainfall, and are indicative of a lot of strength within the cyclone.
Tropical Depression 8 continued to intensify and by August 16, it had strengthened into Tropical Storm Gordon, the seventh tropical storm of the Atlantic Ocean hurricane season.
At 5 a.m. EDT, Tropical Storm Gordon had maximum sustained wind near 40 mph (65 kmh), and some strengthening is expected, according to the National Hurricane Center (NHC). In fact, the NHC noted that Gordon could become a hurricane over the weekend of August 18-19 because the storm is expected to track over warm water and encounter very little wind shear.
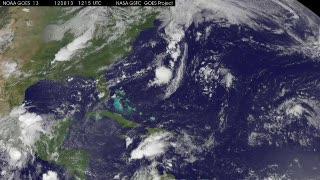
An animation of satellite observations from Aug. 13-16, 2012 shows the birth of the Atlantic Ocean hurricane season's eighth tropical depression that strengthens into Tropical Storm Gordon. This visualization was created by the NASA GOES Project at NASA Goddard Space Flight Center, Greenbelt, Md., using observations from NOAA's GOES-13 satellite.
(Photo Credit: NASA/NOAA GOES Project Center)
The center of Tropical Storm Gordon was located about 585 miles (940 km) east of Bermuda, near latitude 32.2 north and longitude 54.8 west. Gordon is moving toward the north-northeast near 14 mph (22 kmh) and is expected to turn northeast and east, heading back into the north central Atlantic Ocean.
The NOAA GOES-13 satellite captured a visible image of newborn Tropical Storm Gordon on August 16 at 1145 UTC (7:45 a.m. EDT). The image shows that Gordon is a small storm. Tropical-storm-force winds extend outward from the center to only 25 miles (35 km) and those are mostly east of the center of circulation. The GOES-13 image shows that small central dense overcast has formed near Gordon's center. The image was created at NASA GOES Project at the NASA Goddard Space Flight Center in Greenbelt, Md. NASA's GOES Project creates images and animations from NOAA GOES satellite data.
The NHC expects Gordon to track east into the Atlantic, and it may affect the Azores.
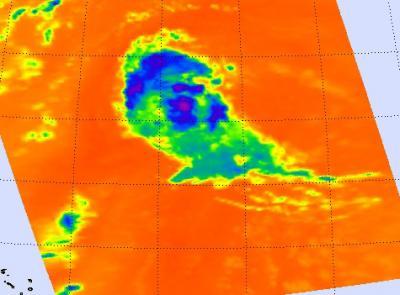
The AIRS instrument onboard NASA's Aqua satellite captured this infrared image System 93L was strengthening into tropical depression 8, and before it became Tropical Storm Gordon. The image was taken on Aug. 15 at 12:53 p.m. EDT, and shows strong bands of thunderstorms (purple) to the north and west of the center of circulation, indicating strengthening.
(Photo Credit: NASA/JPL, Ed Olsen)
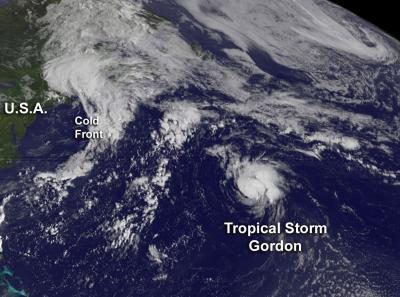
The GOES-13 satellite captured this visible image of newborn Tropical Storm Gordon on Aug. 16 at 1145 UTC (7:45 a.m. EDT).
(Photo Credit: NASA GOES Project)
Source: NASA/Goddard Space Flight Center