NASA's Aqua and TRMM satellites have been providing rainfall data, cloud heights and temperature and other valuable information to forecasters at the Joint Typhoon Warning Center as they track Tropical Cyclones Hadi and Lusi in the South Pacific.
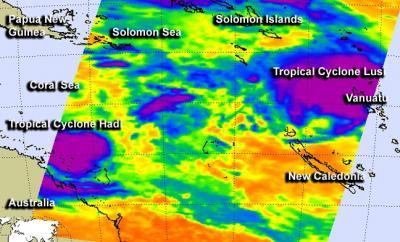
NASA's Aqua satellite captured both storms in one infrared image on March 10 at 14:47 UTC/10:47 a.m. EST. At that time, Hadi was near the east Queensland coast while Lusi was several hundred miles north of New Caledonia. The Atmospheric Infrared Sounder or AIRS instrument captured infrared data that was used to create a false-colored image at NASA's Jet Propulsion Laboratory in Pasadena, Calif. The AIRS image showed that cloud top temperatures in weakening tropical cyclone Hadi were not as cold as those in strengthening tropical storm Lusi. Hadi also appeared to be almost a quarter of the size of Lusi on the infrared imagery.
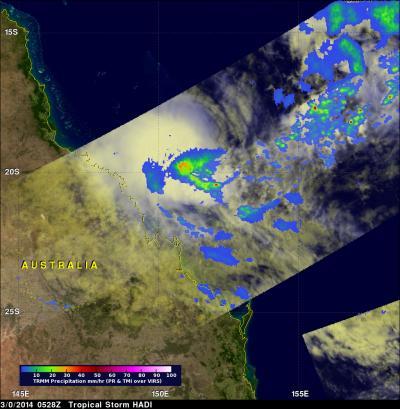
NASA and JAXA's Tropical Rainfall Measuring Mission or TRMM satellite captured data on rainfall rates occurring in both storms on March 10. The TRMM satellite when it flew above tropical storm Hadi on March 10, 2014 at 0528 UTC. TRMM found that almost all heavy rainfall with Hadi was located in the Coral Sea well off the northeastern coast of Australia.

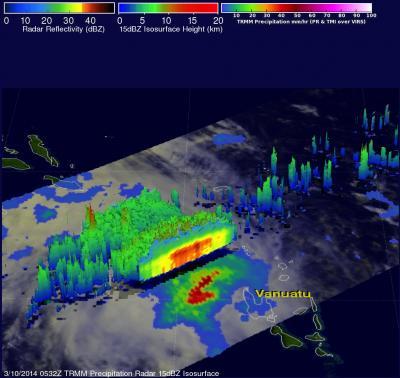
Tropical storm Lusi was located near Vanuatu when TRMM flew overhead on March 10, 2014, at 0532 UTC. TRMM found rain falling over 89 mm/3.5 inches per hour northwest of Lusi's center, and near the center rain was falling at over 57mm/2.2 inches per hour.
(Photo Credit: SSAI/NASA, Hal Pierce)
By 0900 UTC/5 a.m. EST on March 11, Tropical Cyclone Hadi weakened to depression status. Maximum sustained winds had dropped to 25 knots/28.7 mph/46.3 kph. Hadi was about 306 nautical miles/352.1 miles/566.7 km east of Cairns, Queensland, Australia, near 17.2 south latitude and 151.2 east longitude. Hadi was moving to the north-northwest at just 4 knots/4.6 mph/7.4 kph.
The Joint Typhoon Warning Center or JTWC noted that animated multispectral satellite imagery showed that the low-level circulation center became fully exposed and away from the deep convection. When JTWC did an analysis of the upper-level atmosphere they learned that mid- to upper-level wind shear had increased, which is what pushed the convection and thunderstorms away from the center of the storm.
The JTWC noted that there is a possibility that that the remnants will re-organized over the next day as it continues moving to the north-northwest.

The TRMM satellite when it flew above tropical storm Hadi on March 10, 2014, at 0528 UTC. TRMM found that almost all heavy rainfall with Hadi was located in the Coral Sea well off the northeastern coast of Australia.
(Photo Credit: SSAI/NASA, Hal Pierce)
Meanwhile Tropical Cyclone Lusi isn't experiencing wind shear issues. At 0900 UTC/5 a.m. EST on March 11, maximum sustained winds were near 50 knots/57.5 mph/92.6 kph with higher gusts. Lusi is located near 16.4 south and 168.2 east, near Vanuatu. It is centered about 362 nautical miles/416.6 miles/670.4 km north-northeast of Noumea, New Caledonia. Lusi is moving to the southeast at 6 knots/6.9 mph/11.1 kph.
A tropical cyclone watch was in force on March 11 in the Solomon Islands for Temotu, Makira, Rennell and Bellona, Malaita and southern Guadalcanal provinces. Warnings continued for Vanuatu with gale force wind warnings still in effect for Malampa, Penama and Shefa provinces
Lusi is expected to strengthen to 75 knots/86/3 mph/138.9 kph in the next day and a half before becoming extra-tropical north of New Zealand.

NASA's Aqua satellite captured both storms in one infrared image on March 10 at 14:47 UTC. Hadi was near the east Queensland coast while Lusi was several hundred miles north of New Caledonia.
(Photo Credit: NASA JPL, Ed Olsen)
Source: NASA/Goddard Space Flight Center