Edward Olsen of NASA's Jet Propulsion Laboratory in Pasadena, Calif. creates imagery using data from the Atmospheric Infrared Sounder (AIRS) instrument that flies onboard NASA's Aqua satellite. Olsen created imagery from a satellite overpass during the morning hours today, March 19. He said, "The infrared and microwave images show the early phase of the convection blow-up."
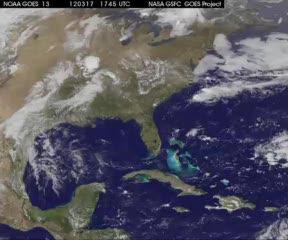
A movie was created using infrared and visible data from NOAA's GOES-13 satellite from March 17 to March 19 at 1740 UTC (1:40 p.m. EST). When the AIRS data was matched with the GOES satellite animation, the blow-up of convection (rising air that forms thunderstorms) appears to have begun around 0245 UTC on March 19 (10:45 p.m. EST on March 18). In the satellite movie, the strong front comes together and resembles an upside-down arrow at the end of the animation on March 19.
GOES-13 is operated by the National Oceanic and Atmospheric Administration and the movie was created by NASA's GOES Project, located at NASA's Goddard Space Flight Center, Greenbelt, Md.
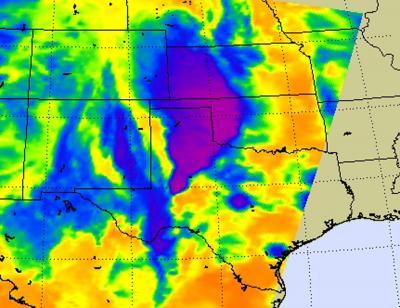
"The line on the Eastern edge of the active region is well established by the time of the AIRS overpass images (at 0853 UTC on March 19)," Olsen said. In the AIRS infrared image, strong convection (strongest on the eastern/leading edge) and cold cloud tops extend from Midland, Texas over the Texas Panhandle and Western Oklahoma and Kansas. The AIRS infrared image on March 19 at 0853 UTC (4:53 a.m. EST) showed cloud top were colder than -63F/-52.7C, indicating strong, high thunderstorm cloud tops that reached high up into the troposphere.
The NASA microwave imagery showed that the strongest convection and likely heavy precipitation was taking place in Oklahoma, just to the east of the Texas/Oklahoma border North of where I-40 crosses that border.
Severe weather is expected in that part of the country over the next couple of days and NASA and NOAA satellites continue to provide forecasters with valuable data.

A movie was created using infrared and visible data from NOAA's GOES-13 satellite from March 17 to March 19 at 1740 UTC (1:40 p.m. EST).The GOES satellite animation shows convection (rising air/thunderstorm development) exploding around 0245 UTC on March 19 (10:45 p.m. EST on March 18). In the satellite movie, the strong front comes together and resembles an upside-down arrow at the end of the animation on March 19.
(Photo Credit: : NASA/NOAA GOES Project)

The AIRS instrument onboard NASA's Aqua satellite captured an infrared image that showed cloud top temperatures in the severe frontal system over Texas and western Oklahoma on March 19 at 0853 UTC (4:53 a.m. EST). The strongest thunderstorms, heaviest rainfall and coldest cloud top temperatures (colder than -63F/-52.7C) appear in purple. The system continued to move east today.
(Photo Credit: : NASA/JPL, Ed Olsen)
Source: NASA/Goddard Space Flight Center