The bedrock hidden beneath the thick ice sheets covering Greenland and Antarctica has intrigued researchers for years. Scientists are interested in how the shape of this hidden terrain affects how ice moves -- a key factor in making predictions about the future of these massive ice reservoirs and their contribution to sea level rise in a changing climate.
NASA has been monitoring Antarctic and Arctic ice since 2009 with the Operation IceBridge airborne mission. Although the primary objective is to continue the data record of ice sheet surface elevation changes from NASA's Ice, Cloud and Land Elevation Satellite, or ICESat, which stopped functioning in 2009, IceBridge is also gathering data on other aspects of polar ice from snow on top to the bedrock below. One radar instrument on these flights that is currently headed to Antarctica for another year of observations is revealing insights about the bedrock hidden beneath the ice sheet.
IceBridge is carrying a suite of radar instruments designed, built and operated by scientists, engineers and university students with the Center for the Remote Sensing of Ice Sheets (CReSIS), a National Science Foundation-funded center based at the University of Kansas.
This bedrock-mapping radar is known as the Multichannel Coherent Radar Depth Sounder or MCoRDS. MCoRDS measures ice thickness and maps sub-glacial rock by sending radar waves down through thick polar ice. This ice-penetrating radar is the result of efforts that started with a collaboration between NASA and the National Science Foundation 20 years ago.
In the early 1980s, researchers started showing interest in using radar to measure ice thickness and map sub-ice rock. Among the interested was NSF's Office of Polar Programs, which provided the initial funding for a thickness-measuring instrument. "We were given one year to prove it would work," said Prasad Gogineni, scientist at CReSIS. CReSIS researchers used that funding to build their first radar depth sounder, which started flying aboard NASA aircraft in 1993. Over the years, CReSIS has built a number of instruments – each more advanced that the last – leading to the radar IceBridge relies on today.
Through the Ice
One of the biggest obstacles faced when building an ice-penetrating instrument like MCoRDS is the nature of radar itself. Radar works by sending out radio waves and timing how long it takes for them to reflect back. Radio waves travel through air virtually unimpeded, but materials like metal, rock and water act almost as mirrors.
Ice, on the other hand reacts differently depending on the radar's frequency. It reflects high-frequency radio waves, but despite being solid, lower frequency radar can pass through ice to some degree. This is why MCoRDS uses a relatively low frequency—between 120 and 240 MHz. This allows the instrument to detect the ice surface, internal layers of the ice and the bedrock below. "To sound the bottom of ice you have to use a lower frequency," said John Paden, CReSIS scientist. "Too high a frequency and signal will be lost in the ice."

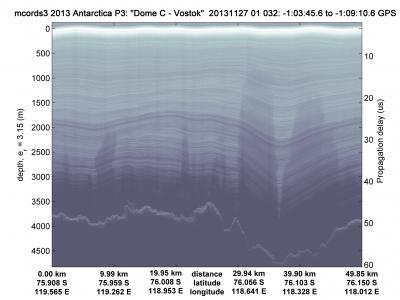
This image shows ice surface, internal layering and bedrock (jagged line at bottom of image) in thick ice between Dome C and Vostok. Data gathered by the Multichannel Coherent Radar Depth Sounder during IceBridge's Nov. 27, 2013 survey flight.
(Photo Credit: CReSIS / Theresa Stumpf)
These radio waves are sent out in rapid pulses through an array of downward-pointing antennas mounted beneath the aircraft. This array of multiple antennas, up to 15 on NASA's P-3, allows researchers to survey a larger area and record several signals at once to get a clearer picture.
The 15 element array is the largest ever flown on the P-3 and is was built as part of a joint effort between NASA, the University of Kansas and private industry. The design and construction of this array, much of which was done by University of Kansas undergraduate and graduate students, took about six months.
Radar pulses travel down to the surface, through the ice to bedrock below and back up through the ice to MCoRDS's array, where they are routed to the instrument's receiver and recorded on solid state drives aboard the aircraft.
Each survey flight yields a great deal of data, often as much as two terabytes, that then needs to be downloaded, archived and backed up. The computing infrastructure needed to handle this data is managed by people from the University of Indiana, which is also a partnering organization in CReSIS. During each campaign, University of Indiana personnel support the mission by staying up through the night to ensure that the data collected each day is successfully stored and backed up.
Processing Pictures
After returning from an IceBridge campaign, CReSIS researchers spend months processing the archived data to build a detailed view of ice sheets and bedrock. First, researchers tease out the return signals from the ice surface and bed. Because thick ice attenuates, or weakens, radar so researchers need to filter the data to pick out the weak return signal from the bed, which would otherwise be drowned out by the much stronger surface return and any noise in the data.
After finding the ice surface and bedrock, researchers use something called synthetic aperture radar processing. This combines many readings from a radar antenna as it moves over the surface researchers can create a large simulated array. "You can make an aperture one kilometer long by moving the radar one kilometer," said Paden. As with camera lenses, bigger is better, and a larger array lets researchers see more detail.
This sort of processing yields a detailed, but narrow, swath of the ice and sub-ice terrain for each antenna. Building a wider view is more complicated than just combining these separate signals. Although MCoRDS records signals coming back from the left and right of the plane's flight path, it cannot determine which side the signals are coming from. To overcome this, CReSIS researchers use something known as tomography, a technique that uses specialized computer software to calculate the position and distance of signals returned from the bedrock. Once researchers can tell where terrain features are relative to the array they can combine the several channels to build a swath of terrain data useful for creating three-dimensional representations of the bedrock.
The Road Ahead
These terrain data are helping scientists better understand what's under ice sheets. In the past year, researchers have produced new maps of Greenland's and Antarctica's bedrock and discovered a large and previously undetected canyon under Greenland's ice sheet. Better information on sub-ice terrain will help researchers develop the next-generation ice sheet models needed to project future changes to glaciers, and better understand the flow of water at ice sheet bases.
As IceBridge continues to add to the record of sub-ice terrain measurements through its surveys over Greenland and Antarctica, scientists, engineers and students at CReSIS will keep making more advances. Improvements such as larger antenna arrays and improved data-processing techniques promise to make radar depth sounding even more effective. And in the future, uninhabited aerial vehicles like NASA's Global Hawk, could greatly increase the amount of terrain that can be covered from the air.
Exactly what the future holds remains to be seen, but researchers have made great strides in probing polar ice thanks to a decision made by one person, former NASA program manager Bob Thomas, who provided Gogineni and his team the opportunity to prove that their instrument worked and funding from NASA's PARCA initiative. "Without that, we would not have a depth sounder and imager program at KU," said Gogineni. "It took both agencies to make it to the stage we are today."

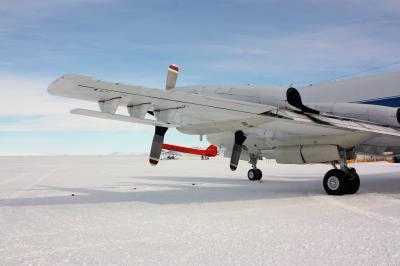
A MCoRDS's underwing radar antenna arrays mounted beneath the wing of NASA's P-3 aircraft at McMurdo Station's airfield is shown. MCoRDS uses arrays beneath the wings and fuselage of the plane, giving a total of 15 antennas that can send and receive signals used to map polar ice and bedrock.
(Photo Credit: NASA/George Hale)
Source: NASA/Goddard Space Flight Center